I’ve been doing my logging the way I’ve always done it for as long as I can remember. So has the dev sat next to me – just not the same way I do it.
That gap doesn’t matter until it does. A payment flow started failing in production a while back, and the incident wasn’t mine to begin with – I got pulled in to help figure out what had gone wrong. The logs told two different stories depending on which service you looked at, the HTTP status codes didn’t match what had actually happened, and there was no way to trace a single request end to end. We weren’t debugging a bug. We were debugging our own observability.
Developers, and in fact whole teams, have always done this. Logging their way, metrics their way, tracing their way if there’s tracing at all – with no standardisation and no one really questioning it until something forces the question.
The Problem with How We’ve Been Doing It
In the past, developers and development teams have always picked their own logging library, their own approach to metrics, their own tracing tool – if there was one at all. Hopefully each team lands on a joined-up decision and the whole team sticks to it. Realistically, it drifts. A new project starts, someone spots the new shiny thing, and suddenly you’ve got another divergence in how it’s done. That’s exactly what caught us out with the payment incident. Different services logged different things, in different formats, with no way to correlate a request across the boundary between them. One service returned a 200 for something that had actually failed downstream. Nobody had decided any of this on purpose – it had just accumulated, project by project, developer by developer.
The result is a mess of logs with no correlation between services, and if you’re not careful, vendor lock-in on top of it. Switching observability platforms further down the line means rewriting instrumentation across everything – a tax you keep paying long after the decision that caused it.
OpenTelemetry is the standard that fixes this.
What OpenTelemetry Actually Is
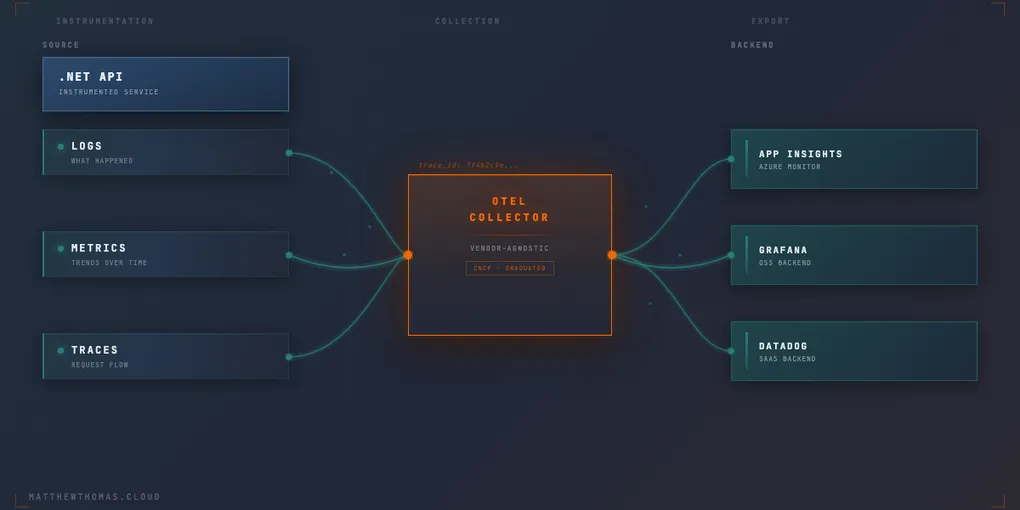
OpenTelemetry is a standard, not a product you drop in and expect to just work. It’s a set of APIs, SDKs, and a collector that let you instrument your application once and then ship the data wherever you want. It’s backed by a community of contributors and the CNCF, who took it on as a project, incubated it, and have now graduated it. You can read more on that here 🔗. It covers all three pillars of observability: logs, metrics, and traces, all under one SDK and one collector. Instrument once, stay vendor-agnostic, and ship to whatever backend you want. Application Insights, Grafana, Datadog, it doesn’t matter. Change your mind later and you can switch backend without re-instrumenting anything.
For me, the bigger win is that it integrates cleanly with the existing ILogger and ActivitySource APIs in .NET. It’s not a rip and replace. It slots into what you’ve probably already got.
The Three Pillars and Why You Need All of Them
There are three pillars of observability, and you need all three to actually get anywhere when something’s gone wrong:
- Logs – what happened. Structured, correlated, meaningful to whoever’s on call, not just the developer who wrote them
- Traces – how a request moved through the system, where time was spent, where it actually failed
- Metrics – the aggregate picture, trends over time, the thresholds that trigger an alert
That was the exact gap in the payment incident. The logs told us something had gone wrong, but not where. No traces meant we couldn’t follow a single request across services. No shared metrics meant nobody had even noticed the failure rate creeping up before it became a fire. Each pillar answers a different question, and missing even one of them leaves you guessing at exactly the moment you can’t afford to.
Getting Started in .NET
Getting OpenTelemetry into a .NET API is a lot less painful than it sounds, mostly because it’s designed to sit on top of what you’ve already got rather than replace it. Start with the SDK and the Azure Monitor ASP.NET Core distro:
dotnet add package OpenTelemetry.Extensions.Hosting
dotnet add package Azure.Monitor.OpenTelemetry.AspNetCore
Then wire it up in Program.cs:
using Azure.Monitor.OpenTelemetry.AspNetCore;

var builder = WebApplication.CreateBuilder(args);

builder.Services.AddOpenTelemetry().UseAzureMonitor();

var app = builder.Build();
app.Run();
The key line here is .UseAzureMonitor(). It configures Azure Monitor as the OpenTelemetry backend, enabling traces, metrics, and logs to flow to Application Insights without having to configure separate exporters for each signal. The Azure Monitor distro also configures the common ASP.NET Core instrumentation out of the box, so you don’t need to manually add the trace and metric exporters for a typical web application. It also enables Live Metrics by default.
For local development, you can specify the connection string directly in code:
builder.Services.AddOpenTelemetry().UseAzureMonitor(options =>
{
    options.ConnectionString = "<Your connection string>";
});
In production, it’s recommended to provide the connection string through configuration, typically the APPLICATIONINSIGHTS_CONNECTION_STRING environment variable, rather than hard-coding it.
Worth knowing that there’s also an OTel Collector you can put in front of this, a standalone piece of infrastructure that receives telemetry from your app and fans it out to one or more backends. We’re not running one, since Application Insights is our standard destination and there’s no need for the extra hop, but it’s there if you ever want to change backend, or send the same data to more than one place, without touching application code.
The bit that actually sold me on this, though, is correlation. Once this is wired up, a TraceId flows automatically through every log line and every downstream HTTP call made with HttpClient. You don’t have to manually thread a correlation ID through method signatures and remember to log it everywhere. It’s just there, on every log entry, tying it back to the trace that produced it. That’s the exact thing missing in the payment incident. This alone is worth the setup on its own.
What We’re Doing at Work
Adoption is still early. A few projects have started instrumenting with OpenTelemetry, but it’s not a blanket rollout yet, and I don’t think it should be. The pattern that’s worked so far is deliberately narrow: instrument with OTEL, decide on the backend separately, and let each team pick that up as they touch a service rather than forcing a big-bang migration.
The payment incident did more for adoption than any amount of advocating for it beforehand ever could. It’s hard to argue against a shared standard when you’ve just spent hours guessing your way through someone else’s logs in production. That’s usually how it goes with this kind of change. Nobody adopts a standard because it’s tidy. They adopt it because the alternative just cost them an afternoon they didn’t have.
We’re not fully rolled out, and I don’t expect that to happen quickly. But the direction is set, and every service that gets touched now goes in with UseAzureMonitor() rather than whatever that team happened to reach for last time.
Conclusion
None of this was really about OpenTelemetry to start with. It was about the fact that nobody had decided how we observe our own systems, and it took a production incident to make that decision for us. OpenTelemetry doesn’t remove the need to think about observability. What it removes is the excuse not to. The backend you send data to will probably change at some point, maybe more than once. The instrumentation shouldn’t have to change with it. If you’ve been through your own version of this, guessing your way through an incident because nobody agreed on how to log, trace, or measure anything, I’d be interested to hear how you got out of it. Feel free to reach out on LinkedIn.