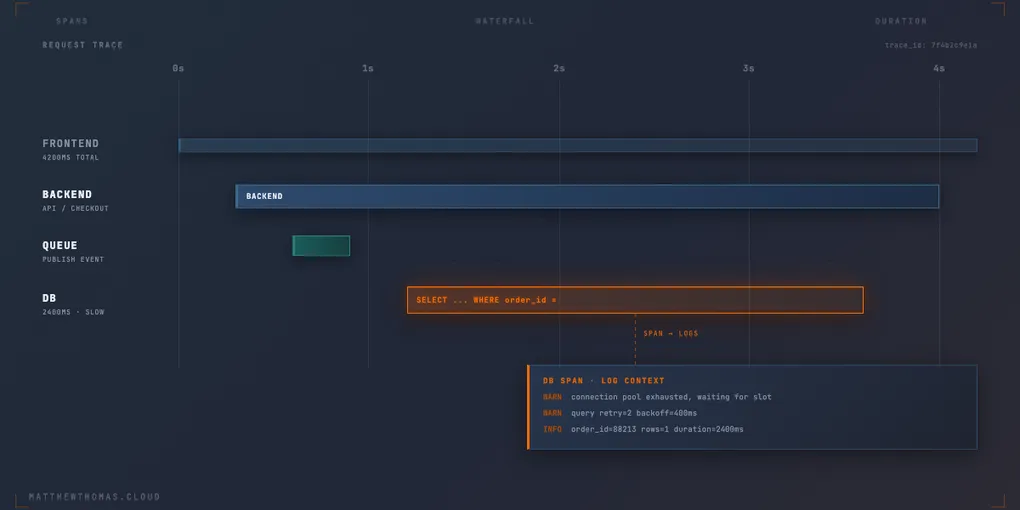
Next up after talking about logging requirements and standardisation with OpenTelemetry, traces and why we need them.
Having good structured logs is a huge win; we can see what’s happening. They don’t tell us the whole picture though, like why a request took 4 seconds.
The gap logging can’t close
Logs give us a discrete view of what happened per event, and we can see what happened in isolation. They can’t show us what happened to the whole request.
When we have multiple services tied together, even just a frontend and a backend, during an investigation we need to stitch together what happened across both.
With just logs we can try our best to put it together across the services, and yes we often can, but can we do it quickly and consistently?
Why ad-hoc tracing doesn’t scale
Most teams, hopefully, are already adding correlation IDs somehow, but not everyone does.
When we have the correlation ID, we can trace through the logs manually of each service and tie together what happened as best we can.
This falls over though pretty quickly, you add a new service and it’s not been done, you’ve got a queue in the request path, or a new starter doesn’t know the convention or how to do the tracing.
OTel doesn’t just solve how we add tracing; it solves how we add tracing that means the same thing everywhere. Implementing a proper standard means there is no excuse for it getting skewed between teams or services. Context propagates automatically across HTTP, gRPC, and most queue clients, so every span has the same shape regardless of which language wrote it.
What actually changes day to day
How does OTel actually change it? Well, we can instrument once and then it’s automatic per request. Lots of frameworks now have auto-instrumentation, so you don’t even need to add spans manually for common frameworks. In a .NET API, this is genuinely most of the setup:
builder.Services.AddOpenTelemetry()
    .WithTracing(tracing => tracing
        .AddAspNetCoreInstrumentation()
        .AddHttpClientInstrumentation()
        .AddOtlpExporter());
No manual spans, no passing anything through headers yourself. Every incoming request and every outgoing HTTP call gets wrapped in a span automatically, and the context propagates with it.
That workflow flip is the real payoff. Instead of starting in the logs and trying to reconstruct what happened, you start at the trace waterfall. You can see straight away which span was slow or which one errored, and only then do you go into the logs for that specific span to find out why. The trace tells you where to look. The logs tell you why it went wrong there.
It’s not just an incident thing either. Per-service and per-dependency latency breakdowns fall out of the same data, without anyone manually stitching dashboards together to get them.
Where to start
We’ve all been there trying to implement something new and different to the project or the team.
Start small, don’t try and instrument everything on day one. The chances of you getting a whole sprint to do it all at once are low, and even if you did somehow wangle that, what are the chances it actually remains and the priorities don’t shift.
The best way to get started is to pick an area that has caused you problems and start there. Wire it to whatever backend can actually show you the waterfall.
Now you’ve done one, you can show the value of it to the other developers, operations, and even the product owners. Now you can get the time to do it everywhere else.
Logs and traces aren’t competing
This isn’t traces replacing logs, any more than the logging post was ever arguing logs replace anything. They answer different questions. Logs tell you what happened inside a step. Traces tell you how the steps relate to each other and where the time actually went. A mature setup needs both, and OTel is what lets you get both without maintaining two separate systems that don’t talk to each other.
Worth asking yourself where that leaves your team right now. Is tracing already standard practice, or is it still the thing that gets discussed after the next confusing incident and then quietly dropped?